Summary:
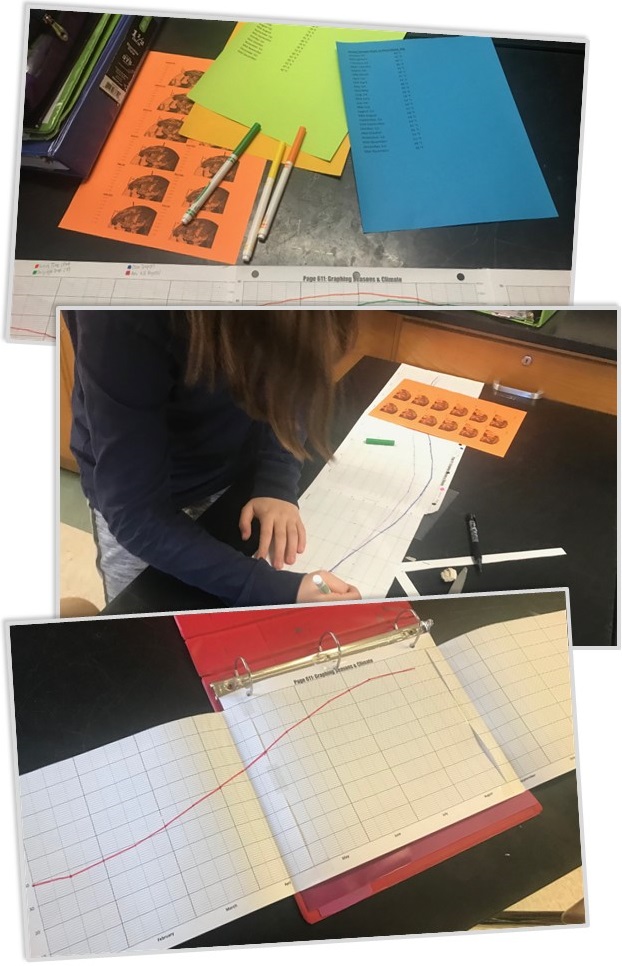
Today students began a project where they will be asked to graph Earth’s season’s and climate… all on one piece of paper! It’s no easy task. They began by taping together a giant three-page line graph that stretches from January all the way to December. Upon that page they will be asked to graph four things: the daily high temperature, the ocean temperature, the time of sunset, and Earth’s tilt. All data was specifically tailored to fit their hometown of Marshfield, Massachusetts. By using a separate axis on the left side (°F), and using a different axis on the right side (time of day), and by squeezing Earth’s tilt to fit that first axis, all three data sets can be overlaid onto the same graph. Most students were about halfway finished by the end of one class period. For more details, see the attachments below.
Resources:
April 9-10 – Graphing Seasons and Climate (pg616).docx
Graph Data – Temperature, Tilt, etc.zip
