Summary:
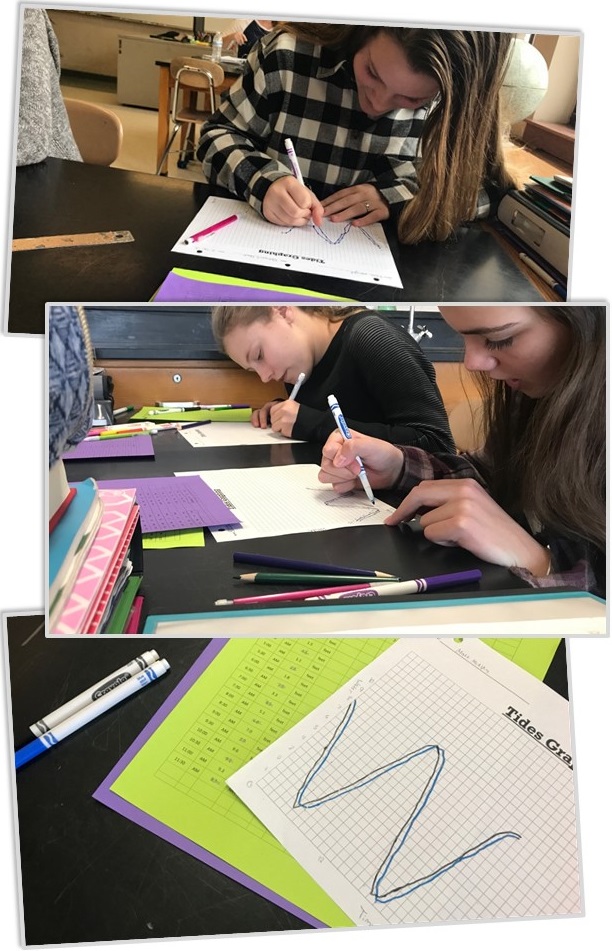
Today we reviewed what we learned yesterday about tides. The moon’s gravity lifts the ocean about +6 feet above its normal depth, the Earth rotates, and every six hours you change tides. But after this discussion, we took it to the next level. Students graphed tide data acquired from NOAA for both today’s tides and yesterday’s. Then they tried to use their graph to predict tomorrow’s tides and answered questions about why these specific tides occurred. The graph and data are posted below.
Resources:
February 16 – Tides Graphing (pg510).docx
Tides Data – Brant Rock – February 15th.pdf
Tides Data – Brant Rock – February 16th.pdf
